
Projects & case studies.
Project experience in survey design, marine and land seismic imaging, reservoir studies and independent technical assurance.
Explore the technical figures ↓10 records

Planning 2D and 3D seismic coverage in a frontier basin
- Challenge
- Earlier surveys recorded weak reflections below shallow, high-impedance layers. The exploration team needed a design that would improve the chances of following reflectors and imaging faults at depth.
- Approach
- VerityGeo undertook survey design and acquisition planning for regional 2D lines and 3D coverage. The scope used signal-to-noise analysis of legacy data to estimate the fold needed at target, and included acoustic and elastic modelling, ray tracing, and acquisition-footprint analysis.
- Design brief
- Survey parameters, recording geometry and planned source and receiver positions
Seabed imaging for geohazard assessment
- Challenge
- Shallow reflectors needed to be resolved in an ocean-bottom node monitor survey.
- Approach
- Separated upgoing and downgoing wavefields and used mirror migration to image the shallow section.
- Documented outcome
- Offset stacks and velocity analysis

Imaging a newly acquired 3D survey
- Challenge
- The survey geometry and near-surface effects needed to be resolved before imaging the target interval.
- Approach
- Reconciled navigation and trace geometry, corrected noise and amplitudes, and applied refraction statics and velocity modelling before migration.
- Documented outcome
- Four processing milestones accepted

Land 3D survey design and target illumination
- Challenge
- How closely should a land survey sample the wavefield to resolve target reflectors, and where would the planned geometry illuminate them?
- Approach
- Tied synthetic seismograms from well logs to legacy seismic, built a layered velocity model and compared two layouts on six profiles along strike and dip. A separate 3D ray-tracing study mapped coverage at depth.
- Documented outcome
- Finer sampling delayed spatial aliasing in synthetic gathers
Merging and reprocessing two legacy 3D surveys
- Challenge
- Two surveys crossed land, transition-zone and shallow-water environments. Differences in grid orientation, source and receiver systems, and sampling made it difficult to follow reflectors across the join.
- Approach
- VerityGeo put both surveys on a common grid, matched their phase and spectra, and applied surface-consistent amplitude scaling and deconvolution. The team updated the velocity model, corrected residual statics and used 5D interpolation to regularise sampling before pre-stack migration.
- Documented outcome
- Merged 3D time- and depth-migrated seismic volumes

Independent assurance of 3D reprocessing
- Challenge
- An independent review was needed to track processing decisions and outstanding quality issues.
- Approach
- Reviewed the legacy inputs and processing steps, recorded quality findings and followed up the responses.
- Documented outcome
- Independent QA/QC service delivered

Seismic inversion for reservoir characterisation
- Challenge
- A field study required reservoir information from an offshore 3D seismic survey.
- Approach
- Integrated seismic inversion and reservoir characterisation in the field study.
- Documented outcome
- Offshore inversion and characterisation study

Interpreting pore pressure from seismic velocities
- Challenge
- A field study required a subsurface pressure interpretation from seismic data.
- Approach
- Used high-definition velocity modelling to support interpretation and pore-pressure prediction.
- Documented outcome
- Velocity-based pore-pressure study
Testing long offsets near growth faults
- Challenge
- Earlier waveform modelling had examined longer offsets near the base of growth faults, where legacy images lost definition. The team needed to test that design on field data before extending it across the survey.
- Approach
- Use data from two early acquisition swaths to test deep reflections. Compare processing parameters, inspect amplitudes by offset and evaluate structural detail with curvature, diffraction imaging and azimuthal studies.
- Specified deliverables
- Pilot gathers, angle stacks and AVO attributes
Preserving amplitudes in a legacy 3D cube
- Challenge
- Reflectors in a legacy cube became harder to follow at depth. The interpretation required both a clearer structural image and interpretable amplitude variation with angle.
- Approach
- Regularise the pre-stack data in five dimensions, build an anisotropic velocity model and apply Kirchhoff migration in time and depth. Track amplitude behaviour through the processing sequence.
- Specified deliverables
- Time- and depth-migrated products for amplitude analysis
Inside the seismic studies
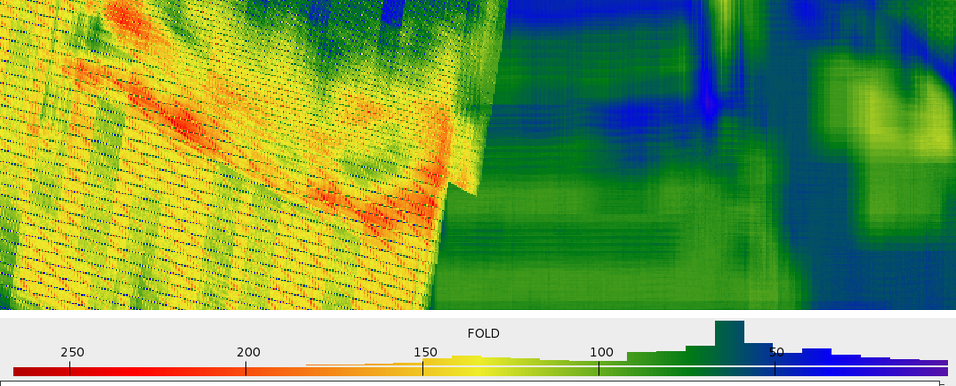
Fold across the survey merge
In this interior part of the common grid, the colours show how many traces contribute to each bin. The scale beneath the map gives the fold.
Open full size — Fold across the survey merge (opens in a new tab)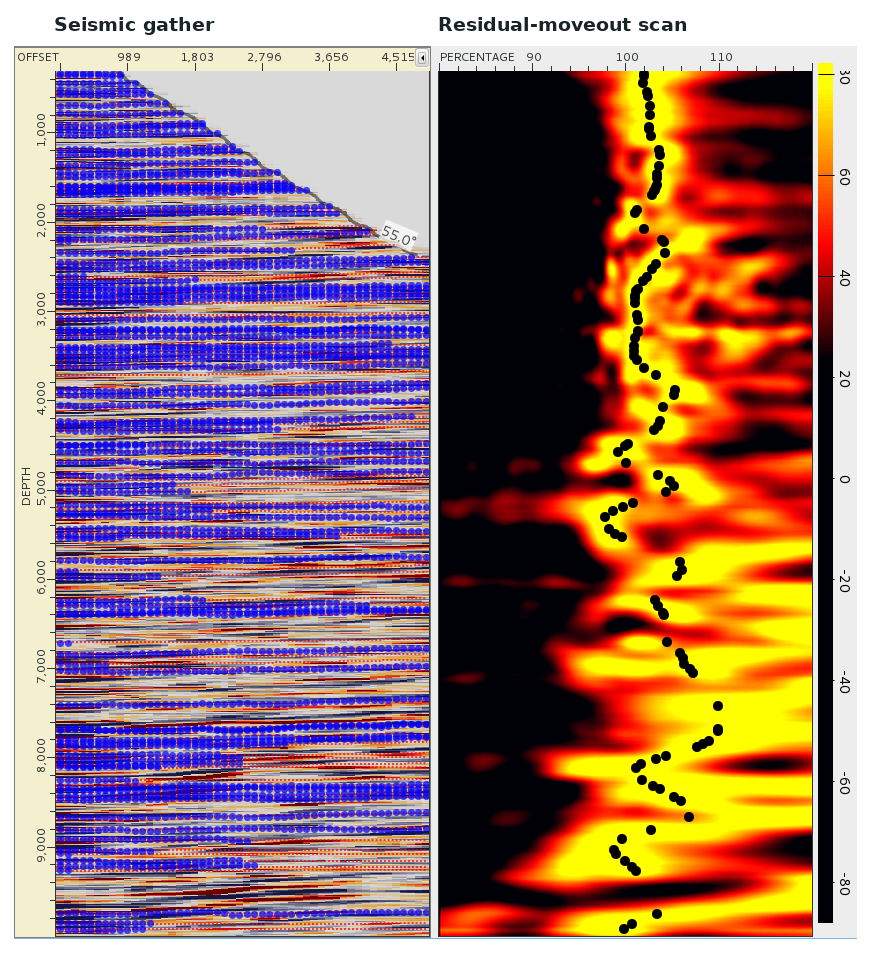
Picking residual moveout
In a previous land imaging study, the gather and percentage scan cover the same depth interval. The black picks follow the scan response used to assess residual moveout in the velocity model.
Open full size — Picking residual moveout (opens in a new tab)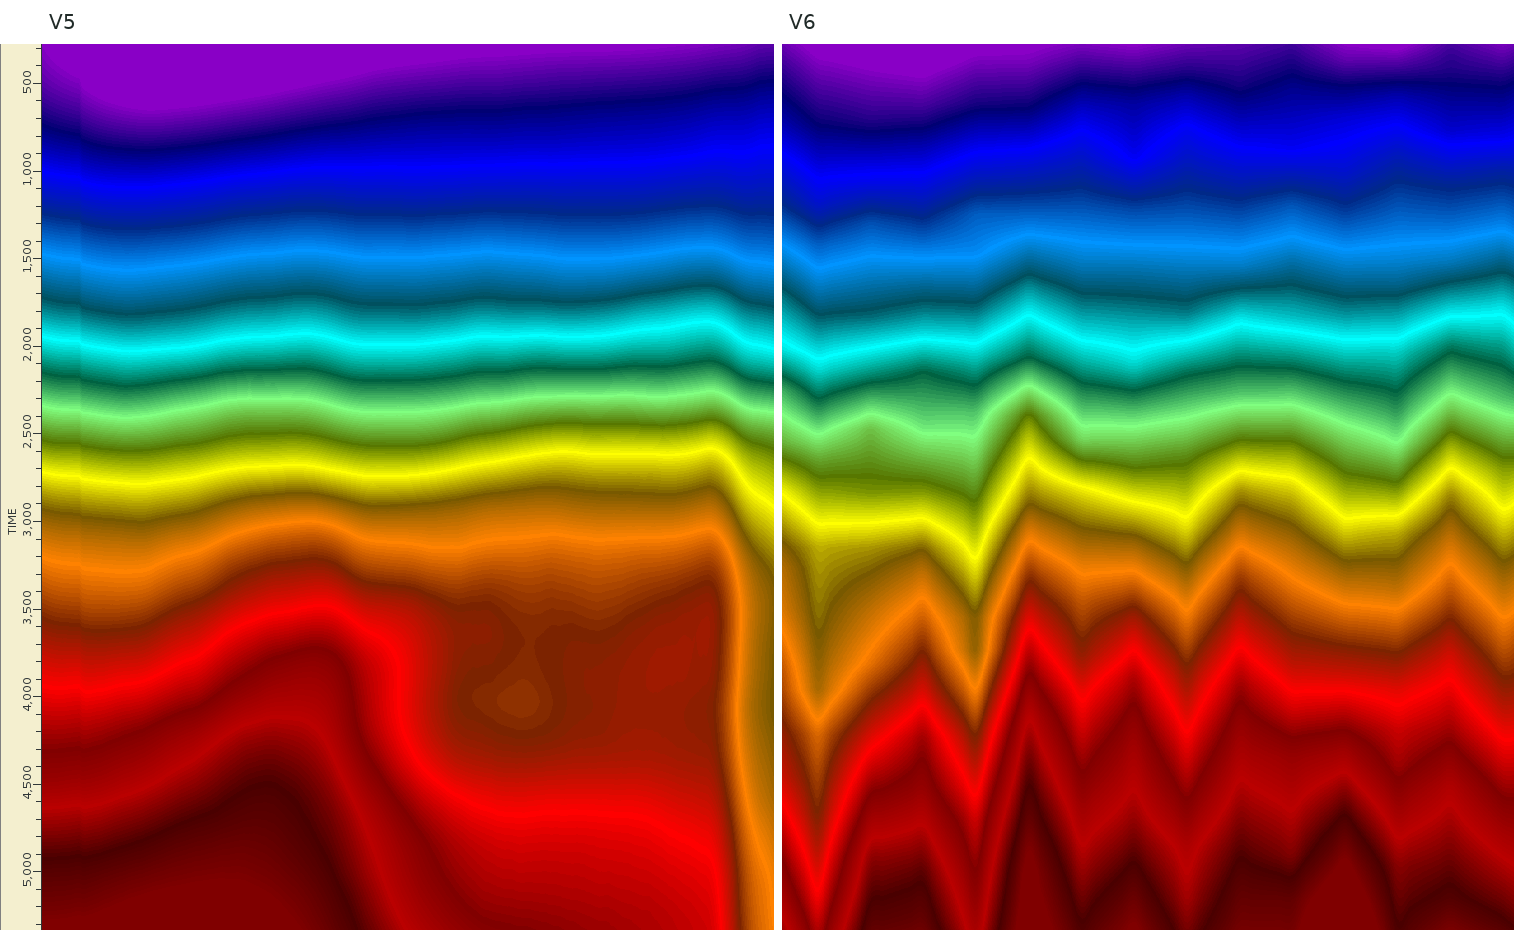
Two iterations of the RMS velocity model
Successive root-mean-square velocity models are shown along the same time section. The comparison lets the processing team inspect lateral and vertical changes between model updates.
Open full size — Two iterations of the RMS velocity model (opens in a new tab)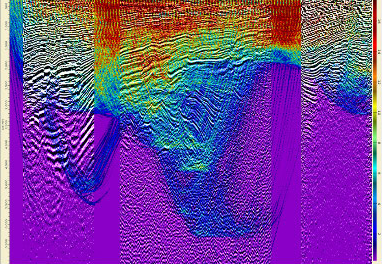
Ray-traced target illumination
Modelled ray coverage over a seismic section. The study found more ray hits in the central target area. The result depends on the survey geometry and velocity model.
Open full size — Ray-traced target illumination (opens in a new tab)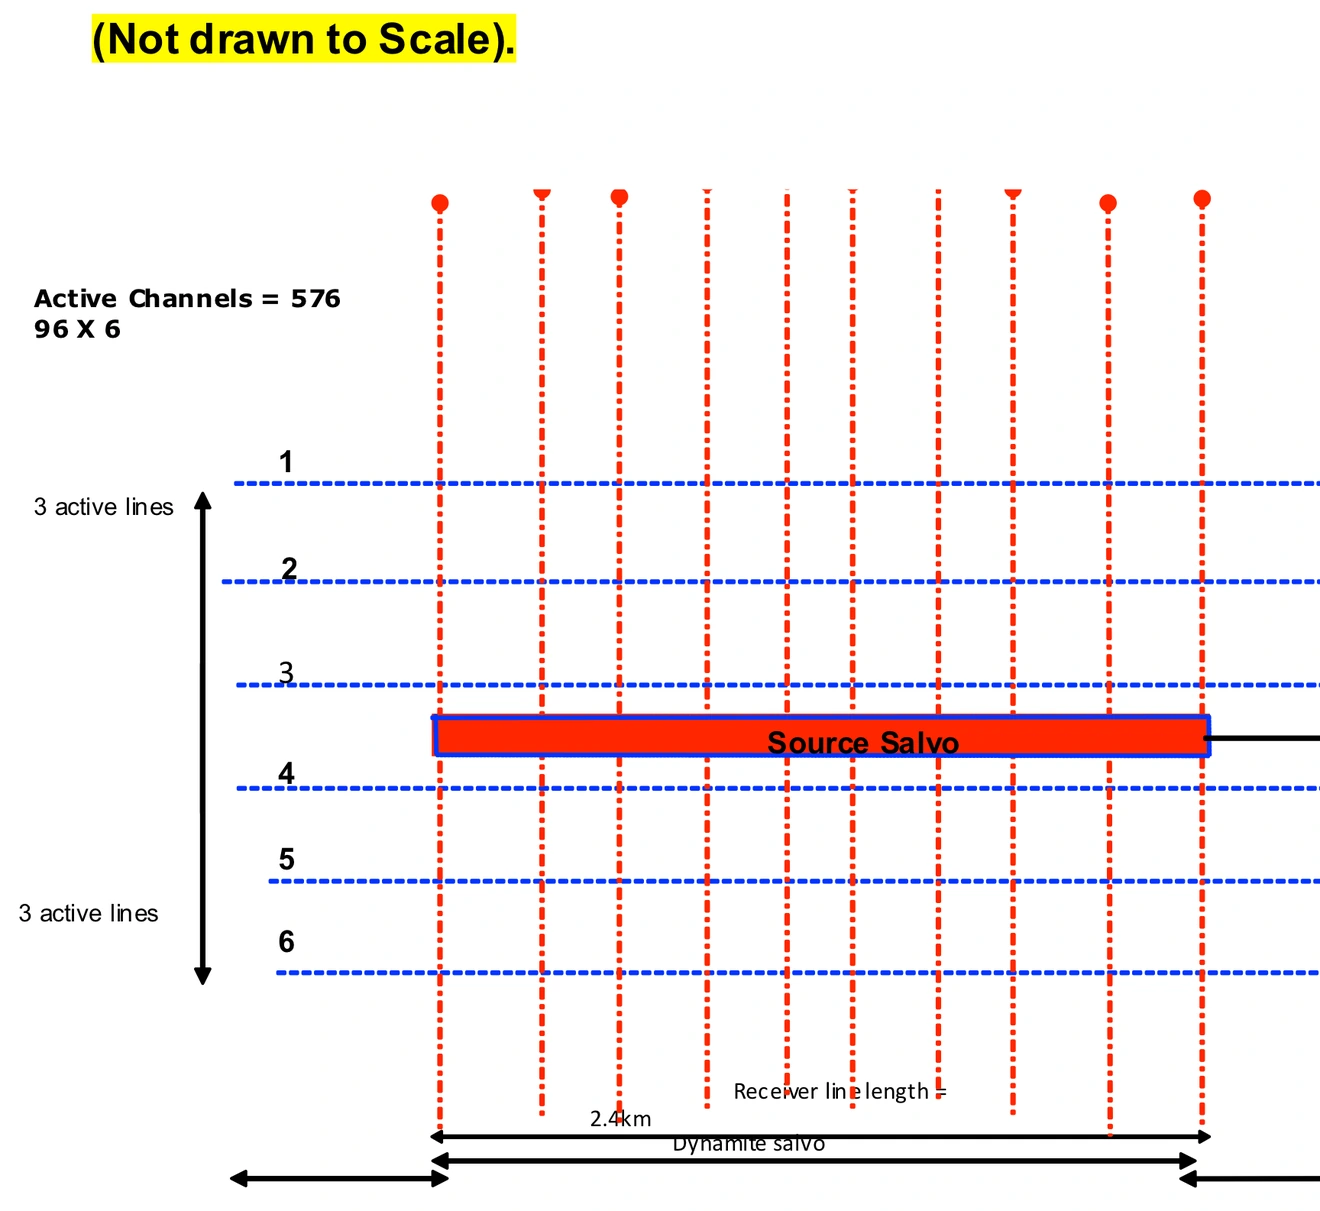
Six-line recording template
The planning schematic places 96 receiver channels on each of six active lines. It shows the source salvo within a 576-channel recording patch.
Open full size — Six-line recording template (opens in a new tab)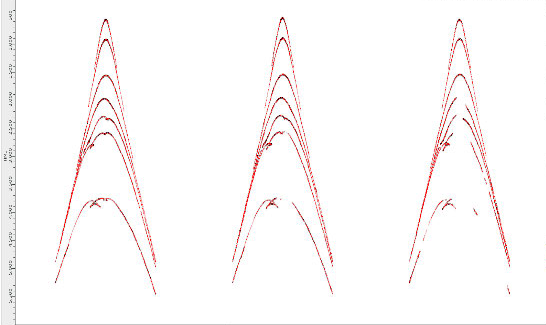
Synthetic shot gathers
Three synthetic shot gathers for the finer land survey layout. The curved events show how modelled reflection travel times vary across receiver channels.
Open full size — Synthetic shot gathers (opens in a new tab)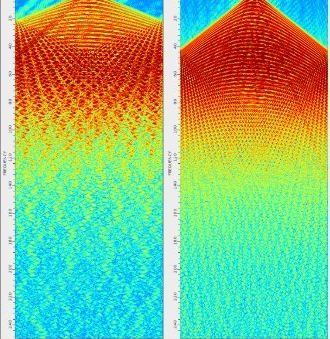
Spatial aliasing in two layouts
Frequency–wavenumber spectra for the coarser layout (left) and finer layout (right). In these synthetic gathers, spatial aliasing appears at about 23 Hz and 44 Hz, respectively.
Open full size — Spatial aliasing in two layouts (opens in a new tab)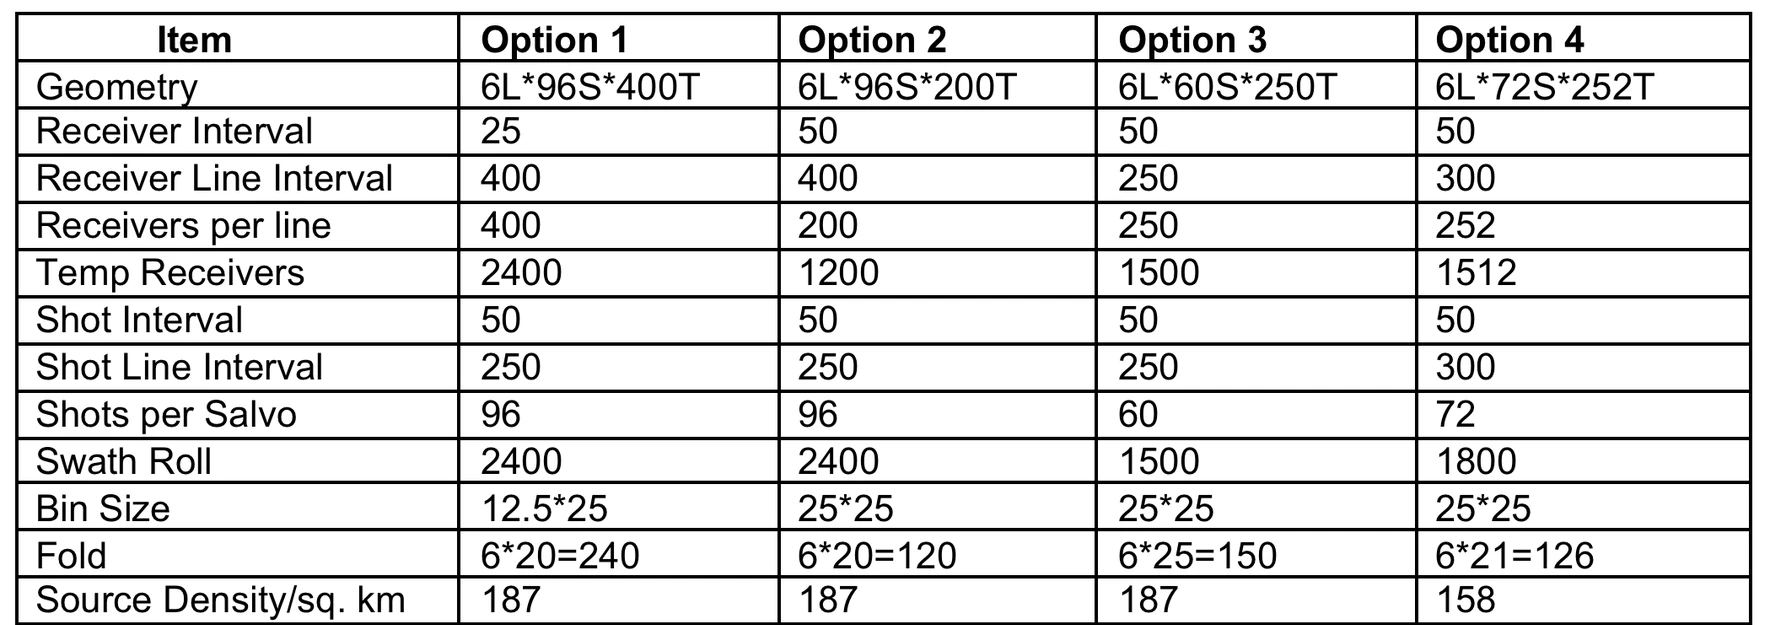
Four candidate survey layouts
The design table compares station and line spacing, bin size and nominal fold for four tentative 3D layouts. Nominal fold ranges from 120 to 240.
Open full size — Four candidate survey layouts (opens in a new tab)